I feel obliged to respond to some of the assertions in the recent editorial by Bartosz Jura in Eurodressage that questions some of my analyses. Firstly, however I express my excitement that others start to approach analysis of such data; while actual dressage is about horses and riders, dressage as a sport is about numbers, so we need to take them seriously.
In April, I wrote a small series of Facebook posts and at their request I sent a compilation to the IDOC, giving permission for them to host them on their website. By definition Facebook posts are not exhaustive scientific documents, but I do have 1,000 such scientific documents to my name and while I could not explain everything in the posts, I approach them with the same rigor as any other analysis I have performed in the past 40 years.
The first figure that seems to cause some excitement is the Standard Deviation of Judge Differences in PSG tests, this also interested Hans-Christian Matthiessen and Wayne Channon in their earlier Eurodressage posts.
To quote Mr. Jura “For marks ranging 1-5 and 9-10, much larger deviation was observed due to both smaller population and of course disagreement between judges on penalties for underperformance and rewards for good performance of exercises. ... However, one cannot draw any more conclusions from presented diagrams, especially since it is only few international PSG results!”
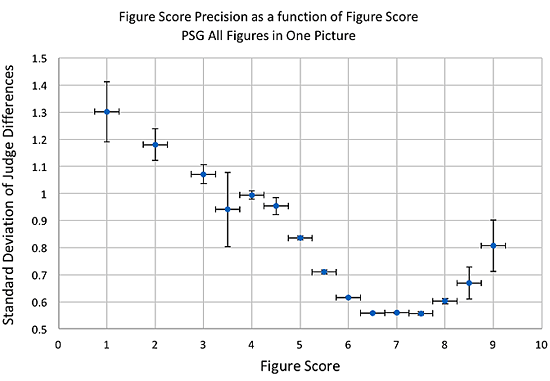
This picture actually shows the standard deviation of the score difference between pairs of judges for National PSG tests as a function of the average figure score of the judge pair. The standard deviation is a standard mathematical measure of the spread of that difference. The picture shows error bars, those in the vertical direction indicate the precision with which the standard deviations are measured. This will be determined both by the spread in the differences and by the number of examples of such differences. Happily, most of the riders score in the 6-8 range for most figures and the judges have a typical standard deviation of 0.6 points, in laymen’s terms this tells us that about 2/3 of the time they will agree with each other within plus or minus a half point, 1/3 of the time even for these common scores the difference will be larger. But for scores like 5 the difference is more like 0.85 points 2/3 of the time and for scores of 4 or below the typical difference is 1 point or more. Those standard deviations are pretty precisely known with an average uncertainty of less than 0.02 points. They are precisely known because the plot contains the results of some 19,000 score comparisons, I’m not sure how much more data Mr. Jura wanted me to use?
Actually, this does highlight an important point, only since January 2017 has it been possible to start to assemble data on International scores in such detail and that data does need to be fully analyzed in order to draw deeper conclusions. My only actual conclusion from this plot was, however, that it indicates quantitatively what most observers would expect, outside of the typical score range of 6-8, judges agree less well with each other. I would consider that actually inevitable, but interesting to see in numbers. This does not just apply to low scores with mistakes, judges also disagree with each other more for the higher scores – so this affects everybody.
In fact, Mr. Jura’s main conclusion, that he must think contradicts mine, but in fact does not, is that the larger differences are due to “disagreement between judges on penalties for underperformance and rewards for good performance of exercises." This is the whole point of work currently underway inside and outside of the FEI, to try to identify practical methodologies that can reduce the frequency and magnitude of these disagreements, and so improve the accuracy of dressage results.
Mr. Jura then turns his attention to the following picture, where I try to find a pattern in the “large differences” that, for example, may be related to the judge’s position. For the same reason as noted above it is only recently becoming possible to study large samples of Grand Prix figure scores, so this particular analysis is based on final scores.
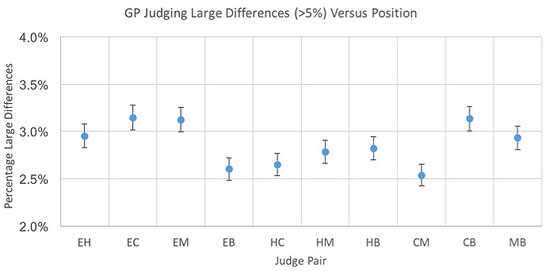
The first point to note is that a term I call Single Judge Precision averages about 1.3% for all FEI judges. With such a precision then sometimes, just statistically, we would expect 5% overall differences, but they should be very rare whereas in reality they occur in about 3% of all comparisons. Since there are typically 5 judges, a judge to judge difference larger than 5% actually happens about once in every 6 riders. All this picture tries to show is that these 5% differences are not especially associated with particular judging positions. (very rare in this case means about once in 14,000 comparisons, even assuming this was just one judge with a result 5% from all the others, it ought to happen no more than once in every seven hundred rides!). So, there is a clear disconnect between usual judging precision and these large differences, they do not arise from the same source.
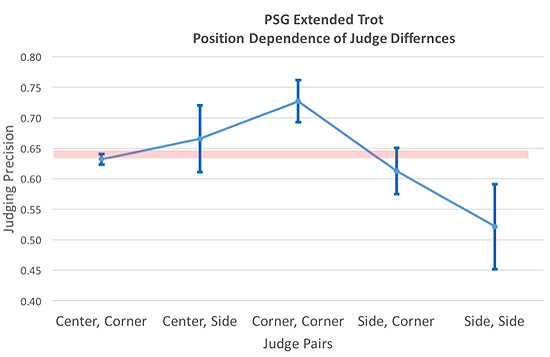
We have also studied of course how this is a function of the movement being performed. The following picture is an example of this. These are again National PSG tests. The position to position differences make sense: for the extended trot the two corner judges have very different views, and not surprisingly the largest differences, while the two side judges have essentially identical views and the resultant smallest difference. However, there is only one Extended Trot in the PSG, and the different viewing angles affect only a few figures for each judge. They cannot explain the frequency of 5+% differences, which anyway we noted above were not strongly correlated with position. (Actually, we already know from previous GDA analyses that 5+% differences are never about large differences for single figures but about a judge being overall 0.5 or more points higher or lower for essentially every figure.)
Let’s be absolutely clear, position affects the differences for a few figures, it has nothing at all to do with the vast majority of large final score differences. The overriding determinant is an imprecision in assigning the penalty for each observed error.
A very common argument is that the judging system is fine, but education (of judges) is not, but actually if you examine the GDA slides on the IDOC website you will see that judging precision is completely unchanged over the last 6 years. Undoubtedly education is vitally important, but we should not necessarily assume it is going to suddenly get better when it has actually been a hot topic for all of that time. So it behooves us to look carefully at the system itself and see if it can be improved.
Finally, for today, so as not to bore you all too much, Mr. Jura objects to my even talking about Single Judge Precision, preferring to use the standard deviation between all the judges. This falls into the oft-cited logic that judging is a “Team Sport”, but it is not. Each judge sits alone in their cabin and tries to come up with the most accurate result they can. The last thing that any of the grand masters of dressage judging, which Mr. Jura cites, would want, would be that a judge cared about what result their colleagues might be giving. This is totally fundamental to the concept of multiple judges. Of course, dressage uses multiple judges to reduce the impact of any single judge on the final score and achieve what we all hope is a consensus view; only in that sense the judges are a team. That is why dressage uses 7 judges in major events, to reduce the chance of one judge steering heavily the final result (while of course, ensuring that each movement is viewed from multiple directions to allow for those real observation differences).
What is certainly clear is that there is a need for this type of analysis and for it to be published and reviewable in detail by all parties. What is also clear is that the newly acquired FEI data from every dressage event at every level will revolutionize this process and allow a much deeper understanding, if people analyze that data carefully without preconceptions. I personally hope that Mr. Jura’s intervention will not be the last and encourage full analysis of dressage data. I have been doing this since before the 2008 Olympics and would be delighted if mechanisms to share, review and constructively criticize such work became the norm.
by David Stickland